Google has sunsetted Universal Analytics on July 1, 2023, and if you’d like to continue tracking LinkedIn Ads performance in Google Analytics, you will need to use Google Analytics 4.
This post explains how to set up LinkedIn Ads tracking in GA4, and how to build a custom report to access familiar campaign metrics in a new interface.
Getting LinkedIn Ads Data to GA4
Google Analytics doesn’t have a native LinkedIn Ads integration, therefore in order to track LinkedIn Ads data in GA4, you will need to set up UTM parameters in your ads. This will let GA4 attribute users’ sessions and subsequent interactions to a specific source (LinkedIn Ads in our case). Otherwise, the session and GA4 will record all subsequent interactions as referral traffic and you won’t be able to segment paid visits from LinkedIn from organic ones.
Best practices for UTMs tags setup
We suggest using the following template to set up UTM tags:
| ?utm_source=linkedin&utm_medium=cpc&utm_campaign=Campaign_group_name&utm_content=Campaign_name&utm_term=Ad_name |
where:
utm_source=linkedin – should be the same for every campaign;
utm_medium=cpc – should be the same for every campaign;
utm_campaign=Campaign_group_name – should be unique for every campaign group;
utm_content=Campaign_name – should be unique for every campaign;
utm_term=Ad_name
Note: the underlined text should be changed to the corresponding values you use in the LinkedIn Ads account.
You can refer to this UTM Parameters Guide for more information about UTM tags and how to use them to track traffic in Google Analytics.
Setting up Reports for LinkedIn Ads Performance Analysis in GA4
There are 2 ways how you can access your LinkedIn Ads data in GA4:
- Standard (built-in) reports
- Create a custom report
Using standard reports in GA4
Let’s take a look at the standard report, which can be found in Reports > Acquisition > Traffic Acquisition. The Linkedin paid campaigns data will be in the Paid Social default channel group:
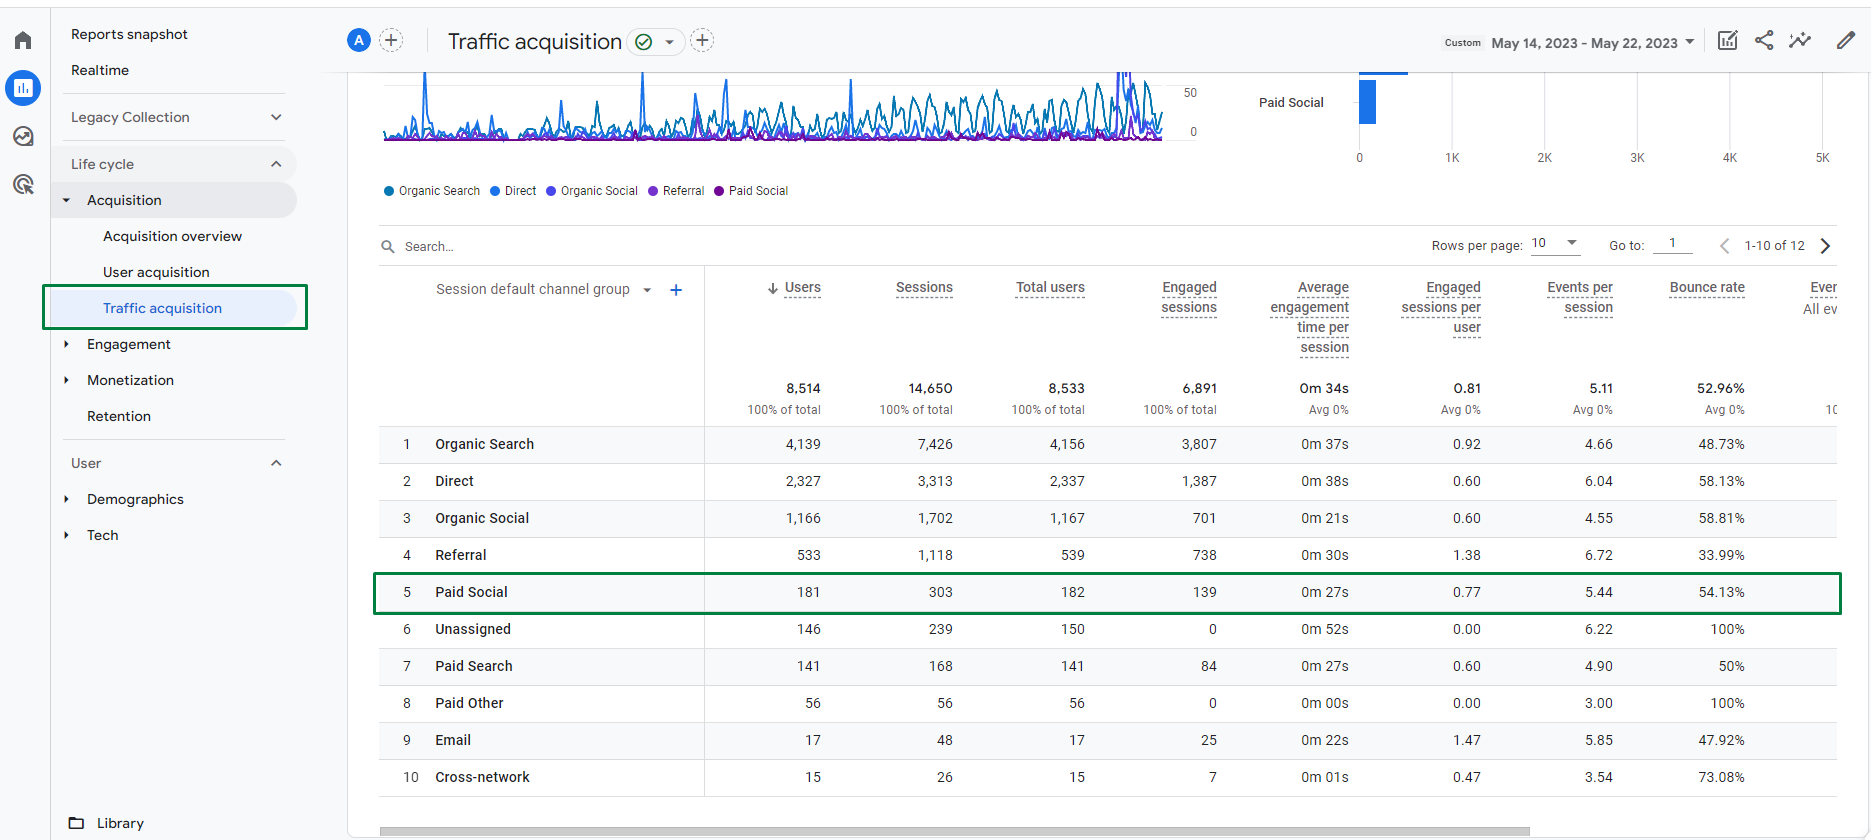
There are several ways how you can access specific LinkedIn Ads data from here:
1. Change the Primary dimension from channels to source/medium.
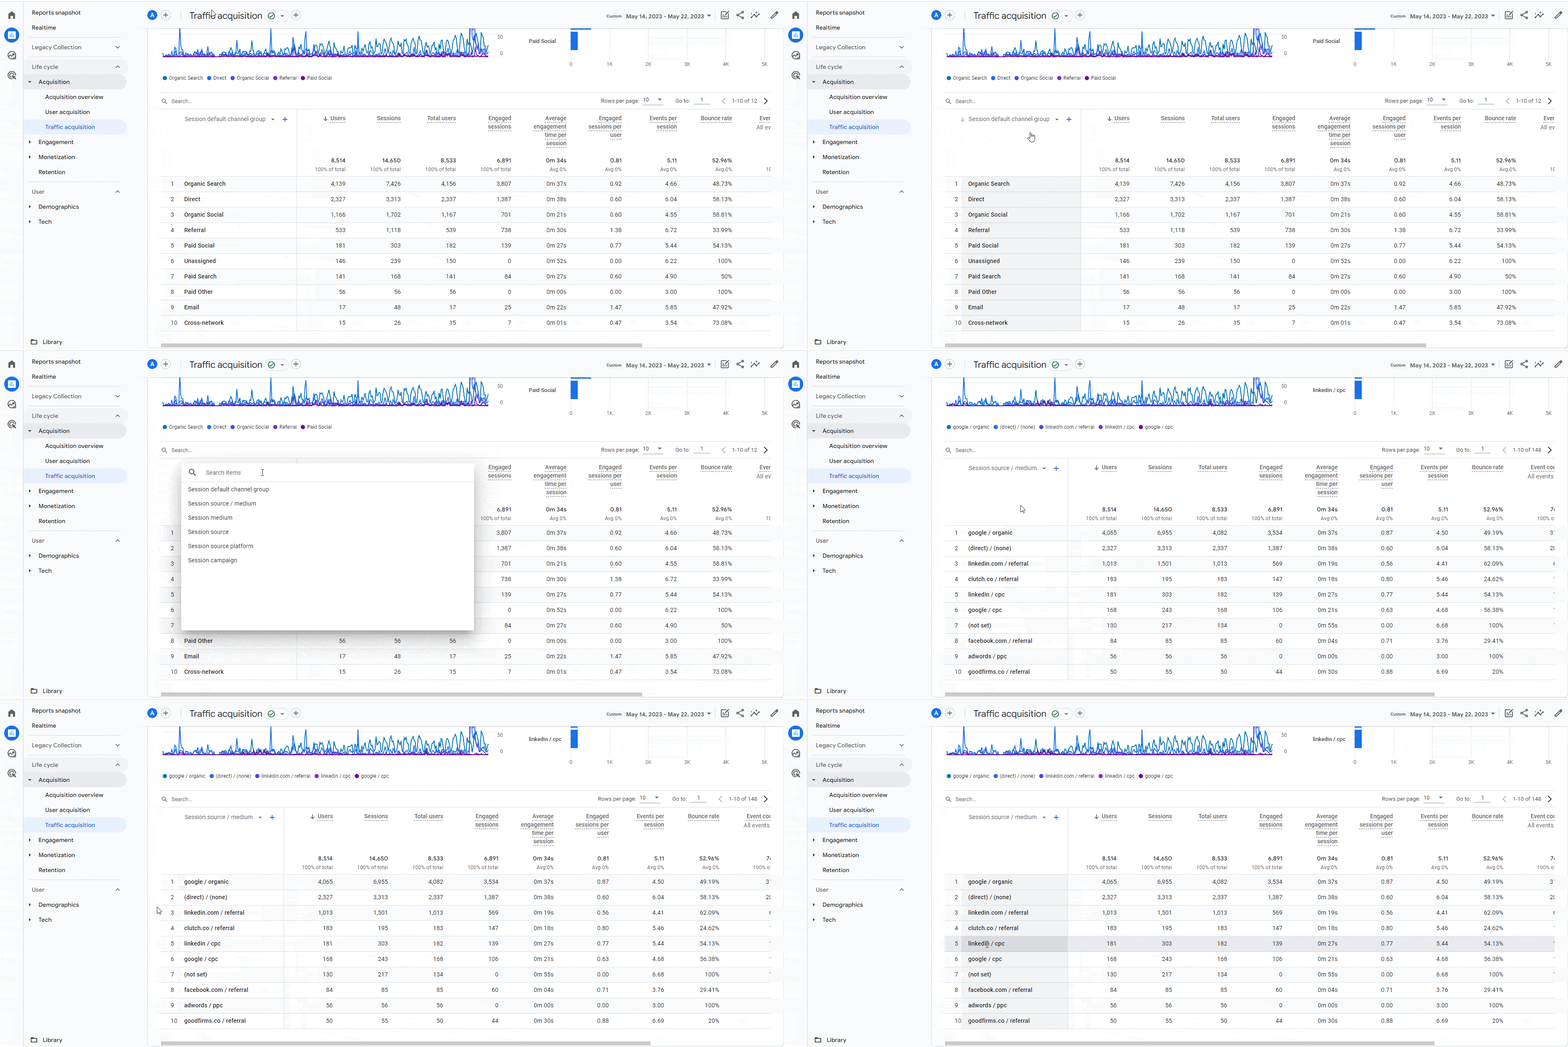
2. Use a filter to include only the linkedin/cpc source:
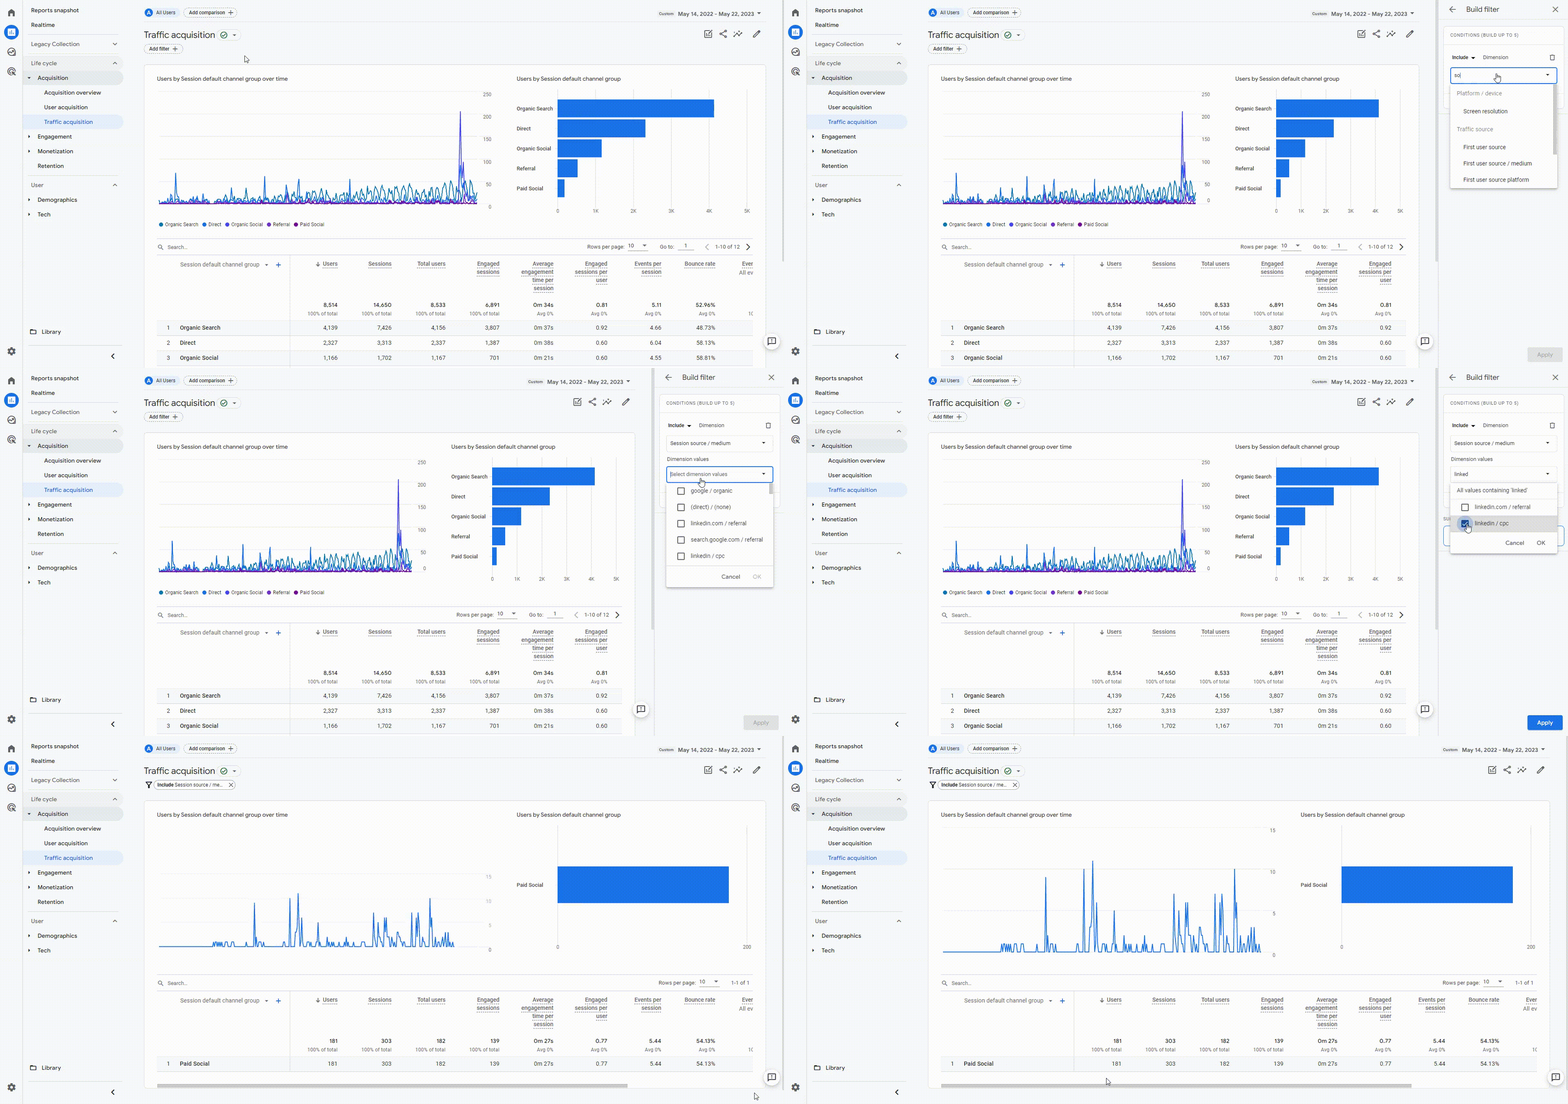
3. Add a secondary dimension source/medium and use the search function:
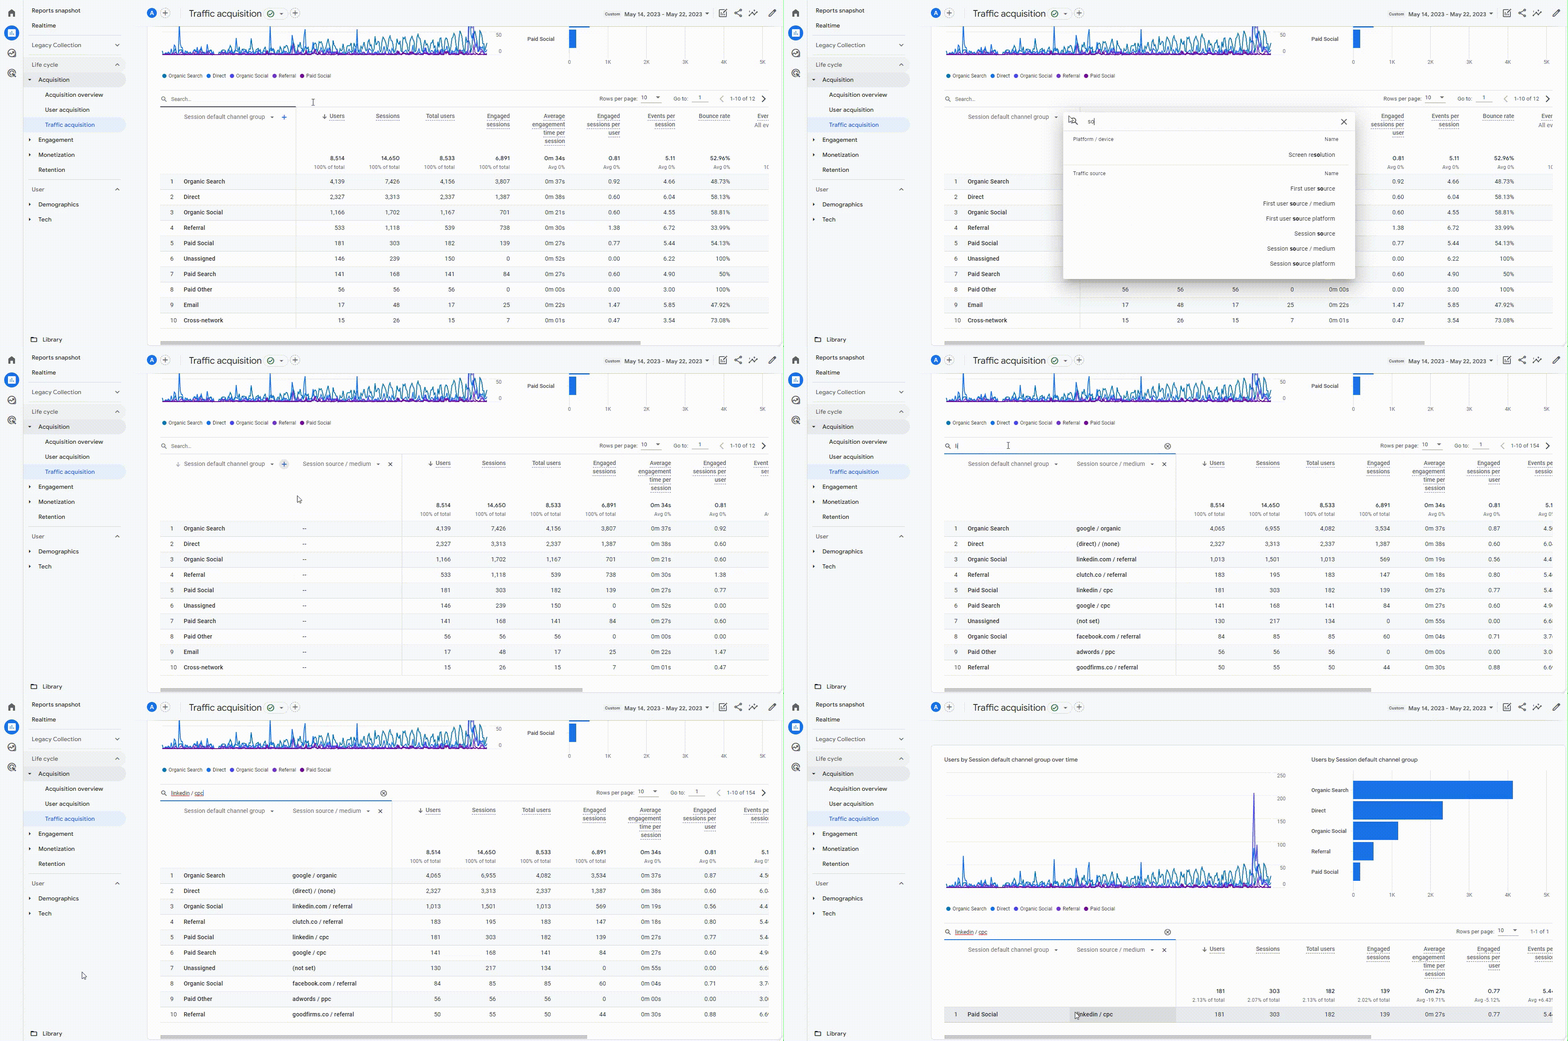
We found these methods to be time-consuming and taking too many clicks every time you need to look at your stats, therefore we recommend setting up a custom report for quick and convenient access to your LinkedIn Ads data in GA4.
Setting up a custom report for LinkedIn Ads in GA4
The main benefit of using a custom report is that you can always have it at your fingertips, with filters already set up and metrics tailored to your Linkedin Ads campaigns analysis.
To create this report and add it to your Standard collection, we will need to use the Library section. You can refer to this video for a detailed overview of how the Library section works in GA4:
11 Steps to Set up an Informative GA4 Custom Report for LinkedIn Ads
Follow these steps to set up and tune a custom report that you can tweak to your analysis needs.
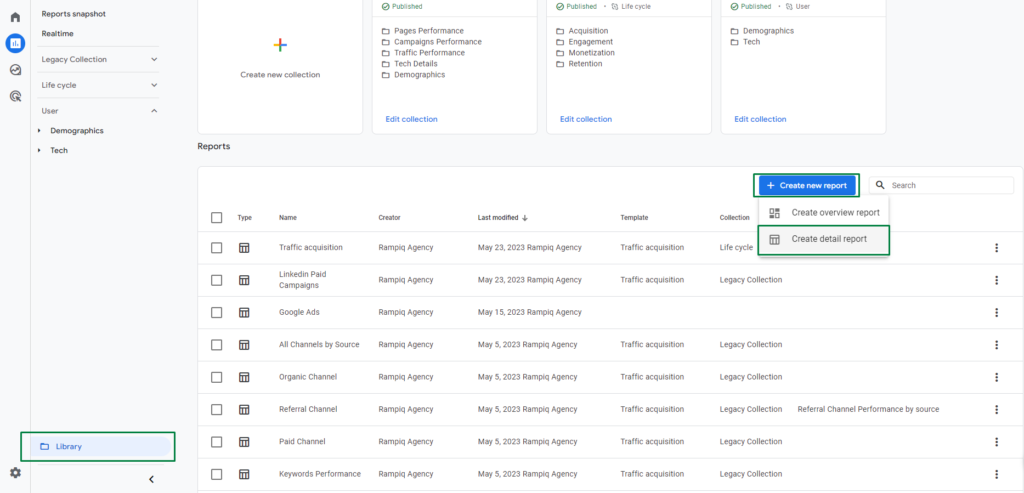
1. Open the Library section, click on the button + Create new report, and select Create detail report.
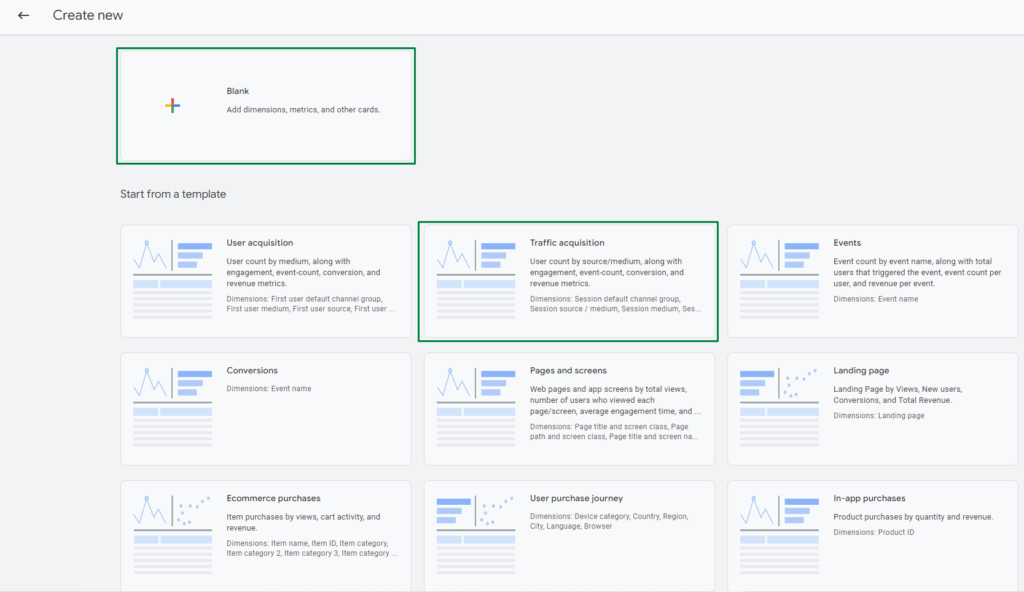
2. Then, you can either use a template or create your report from scratch. Your choice mainly depends on which dimensions and metrics you’d like to be added by default. We recommend selecting the Traffic Acquisition template as it has some preset metrics we’ll need:
3. Now, let’s customize the dimensions, metrics, and filters:
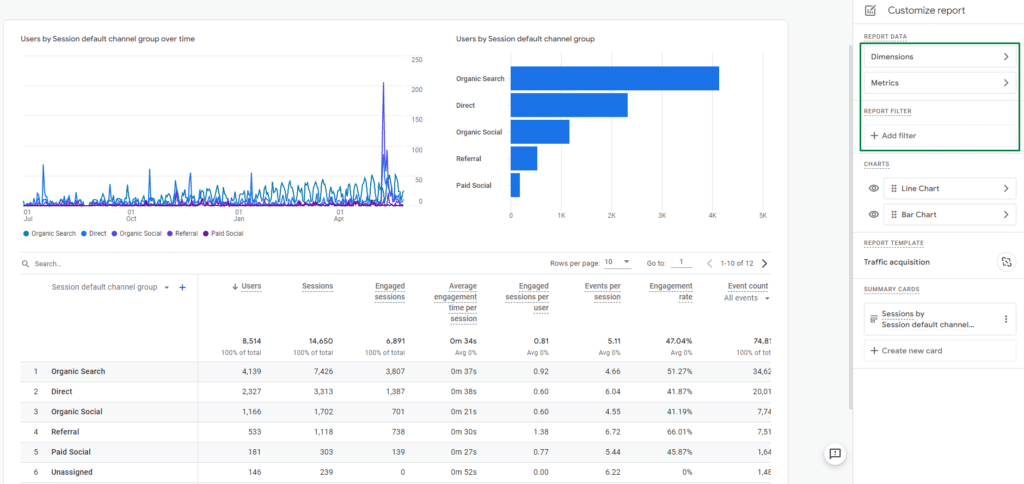
4. Click on the 3 dots and sort the dimensions. Set Campaigns as the default dimension.
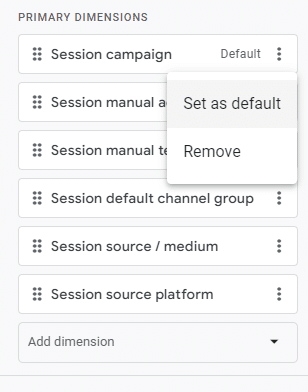
PRO tip: You may have noticed that in GA4 has Session Source and First User Source dimensions. The difference in these dimensions is in the attribution model. We use Session Source, the attribution that is set by default in GA4 (Data-Driven).
5. You can leave the default set of metrics, but at this point, you can also add Session conversion rate, Bounce rate, and other metrics you’d prefer to analyze. Here’s the recommended set of metrics to use:
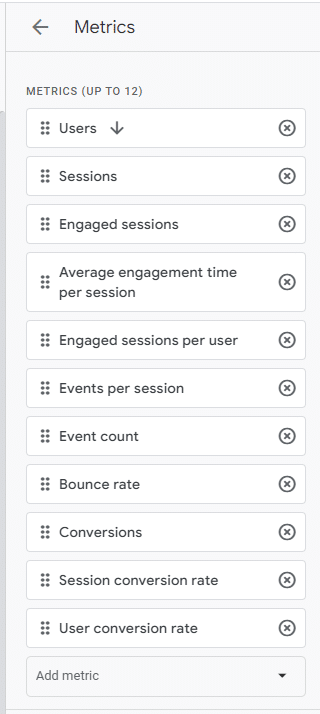
PRO tip: Note that there are 2 types of conversion rate metrics in GA4.
Session conversion rate: The number of conversions in a selected time period divided by the number of sessions in the same period. The Session conversion rate is how the conversion rate was calculated in Universal Analytics.
User conversion rate: Counts the same way, only instead of sessions, we take users with conversion divided by the total number of users. This metric is unique for GA4.
Depending on the types of conversions you track, comparing these metrics can be insightful for your LinkedIn Ads campaigns analysis.
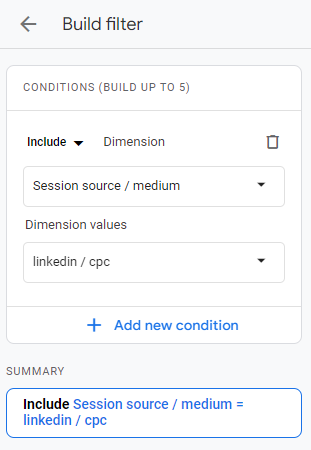
6. Important step! Now we need to add a filter that will only include source/medium = linkedin / cpc. Apply your changes after you set up this filter:
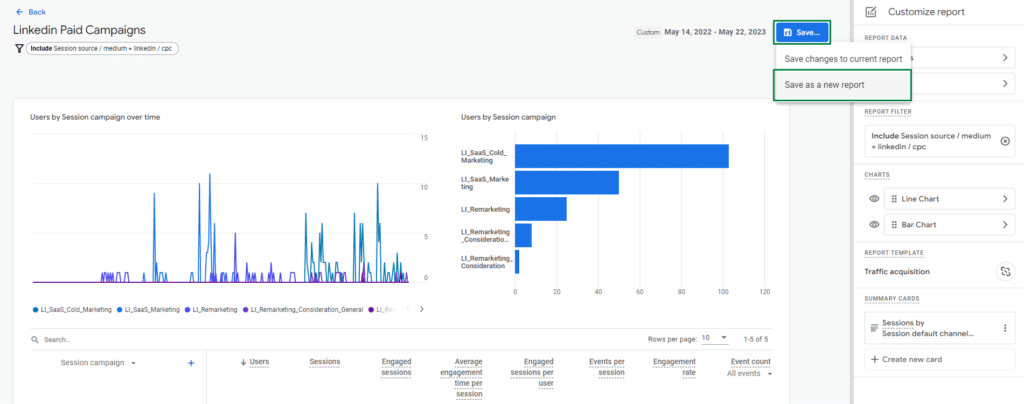
7. Click Save and select Save as a new report. Set the name of the report, for example, Linkedin Paid Campaigns:
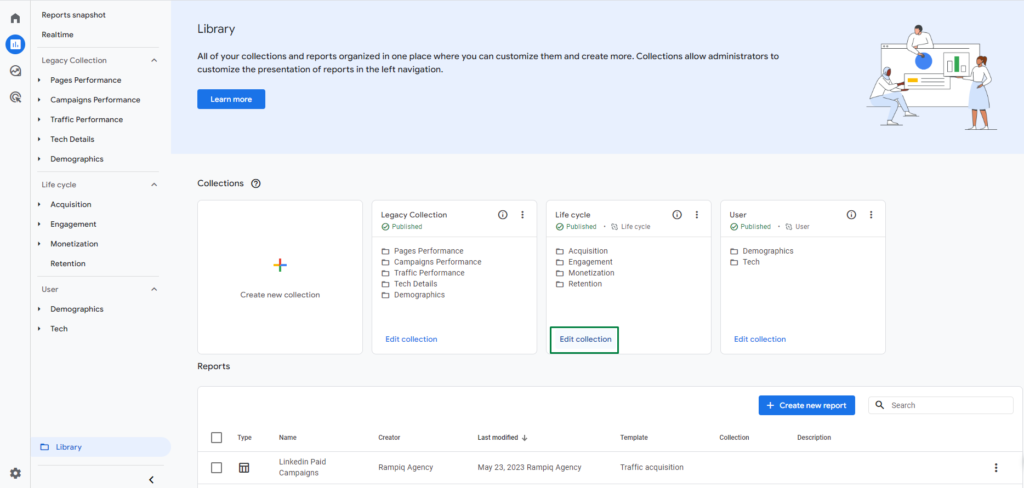
8. On the main page of the Library section, select the collection to which you want to add a new report and click Edit Collection:
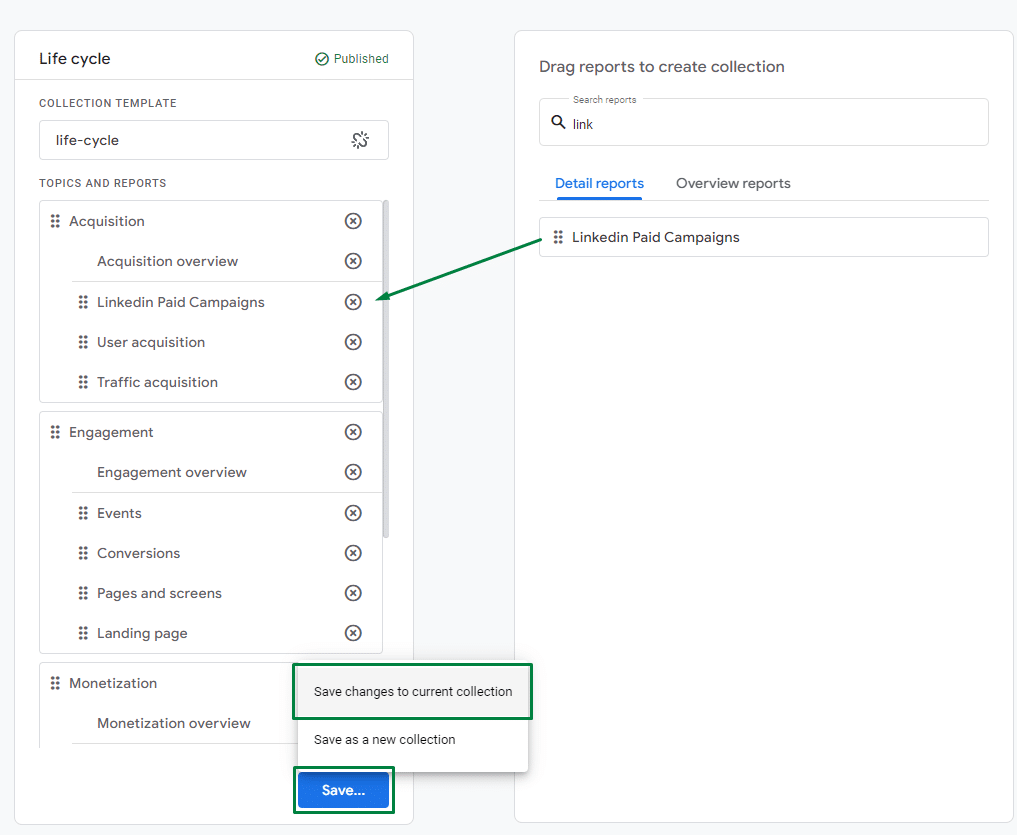
9. Find the report you’ve just created and drag it into one of the existing topics. Save changes to the current collection:
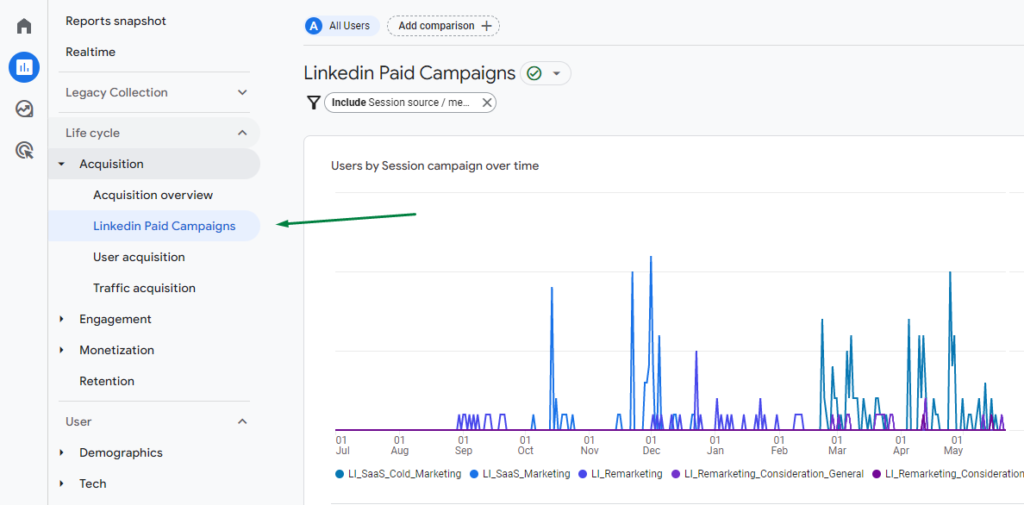
10. Congratulations! You can now find the new report in the Standard collection:
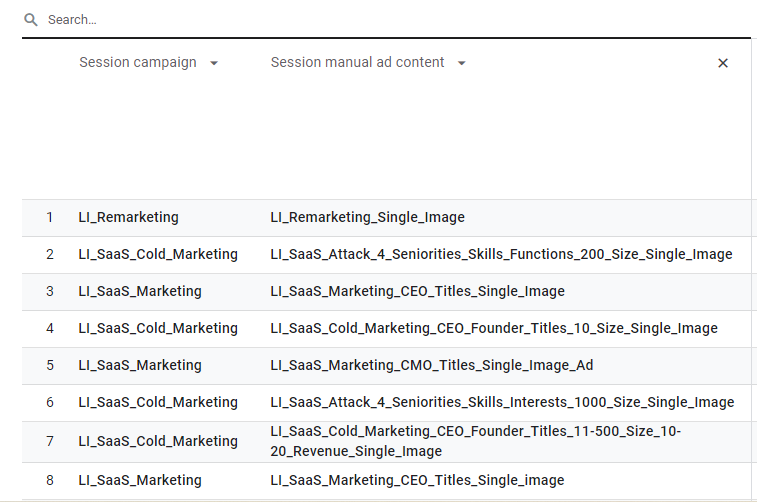
11. Bonus step: when you use this report, feel free to change the primary dimension by selecting a term, and content, or by adding these metrics to the secondary dimension to get more visibility into individual campaigns and ads performance:
Questions?
Please feel free to leave them in the comments and we’ll do our best to provide additional clarifications on how you can analyze LinkedIn ads in GA4.
Need more information about how to migrate to GA4? Read the linked blog post for a detailed guide to the migration process and grab a free checklist.
Alternative (And Better!) Ways to Track LinkedIn Ads Performance
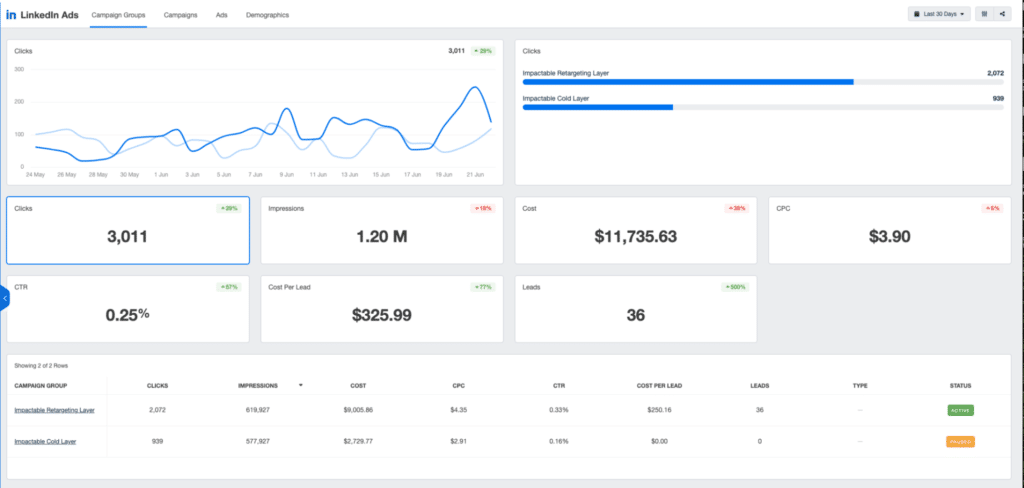
Impactable has rolled out DGP, which is a LinkedIn ads SAAS toolset which allows for some additional insights that Linkedin native campaign reporting will not show.
Below is an overview of the DGP Linkedin Ads dashboard, which already makes it much easier to show trends and insights over time and make comparisons vs Linkedin campaign manager.
One of the best features of DGP Linkedin Ads reporting though is advanced demographic breakdowns.
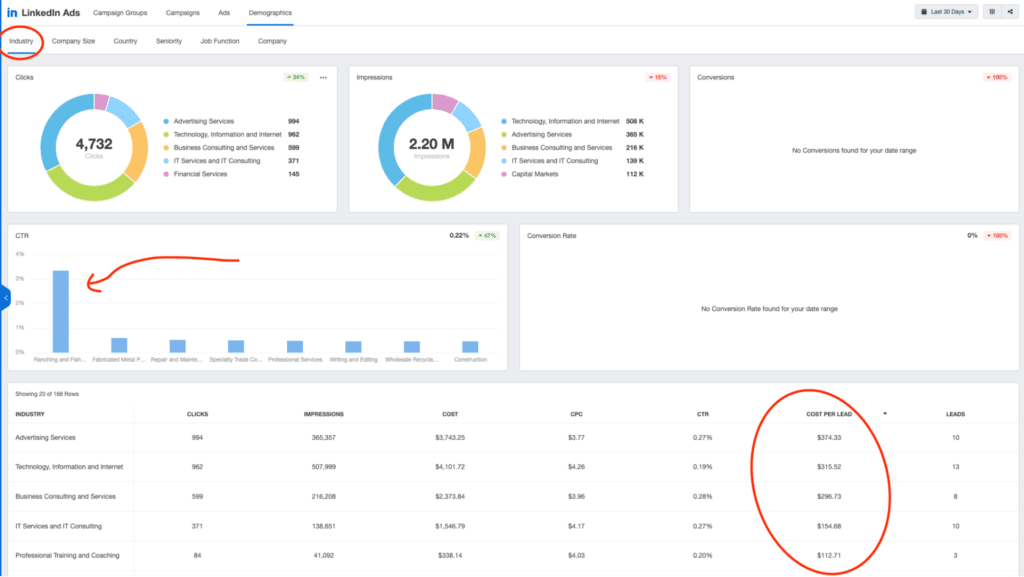
In the above image, you can see we are able to see a demographic breakdown of results of CTR, CPC, and even CPL and conversions.
This is big because Linkedin native campaign manager does not allow you to see demographic breakdowns separated out if they are all targeted in the same campaign.
But with DGP, we are able to see exactly what industry, company size, geography, etc that we are getting the most traction with.
Knowing that we are getting 3x higher conversion rates with the software vs banking industry is a massive insight that can help optimize the campaign.
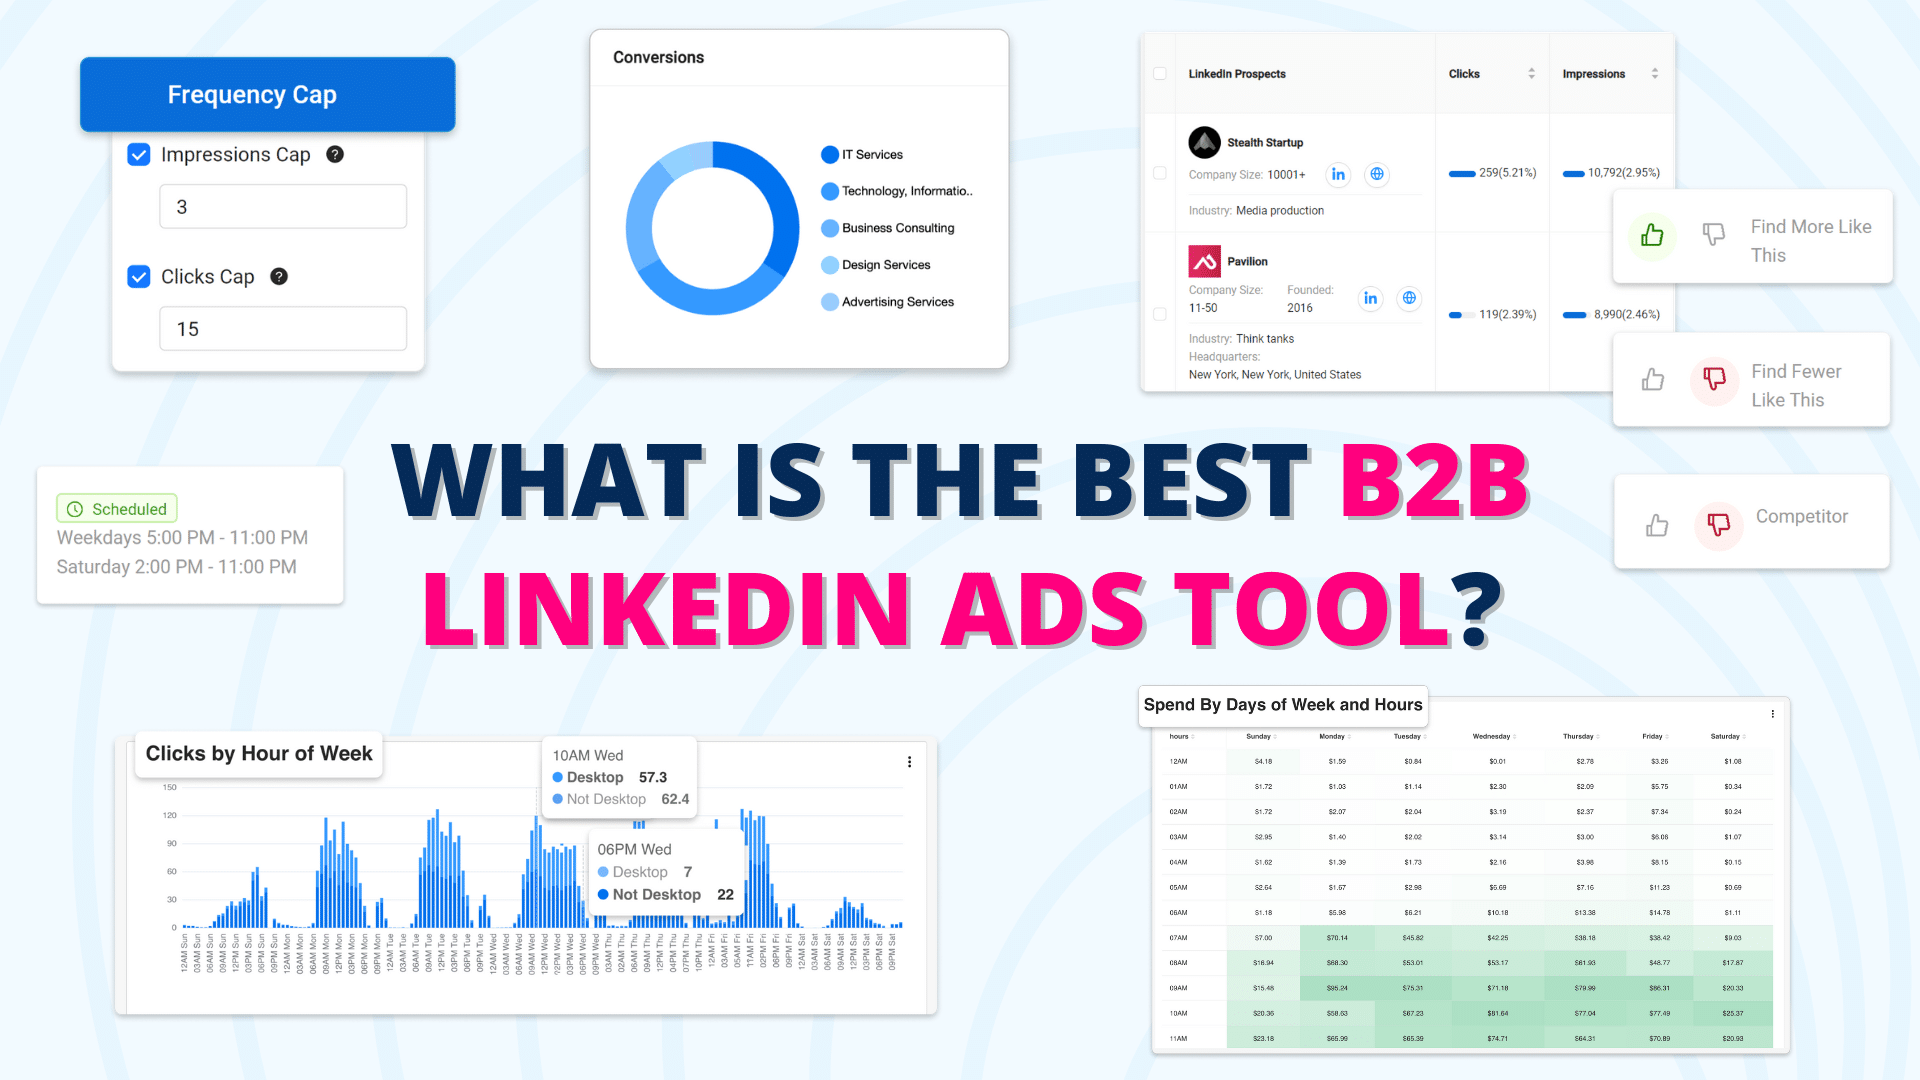
In addition to these conversion and lead insights, DGP also allows users to schedule and rotate Linkedin campaigns and set frequency caps as well.
In addition to DGP, we also absolutely love our friends at Agency Analytics and Hockeystack for making amazing reporting and attribution tools!
 Written by Liudmila Kiseleva

