
Clicks and CPL only show a tiny slice of what LinkedIn is actually doing for you. If you treat LinkedIn like search, you’ll miss the impact happening long before anyone touches a form.
LinkedIn behaves closer to a billboard than a conversion machine. People see you, think about you, ignore you, see you again, and only then take action.
Real efficiency shows up through signals across the entire funnel, not just the last click.
Our LinkedIn Ads Funnel Benchmarks and the LinkedIn B2B Benchmark Report make that clear. The data shows where the real drop-offs happen and which numbers actually predict downstream revenue movement.
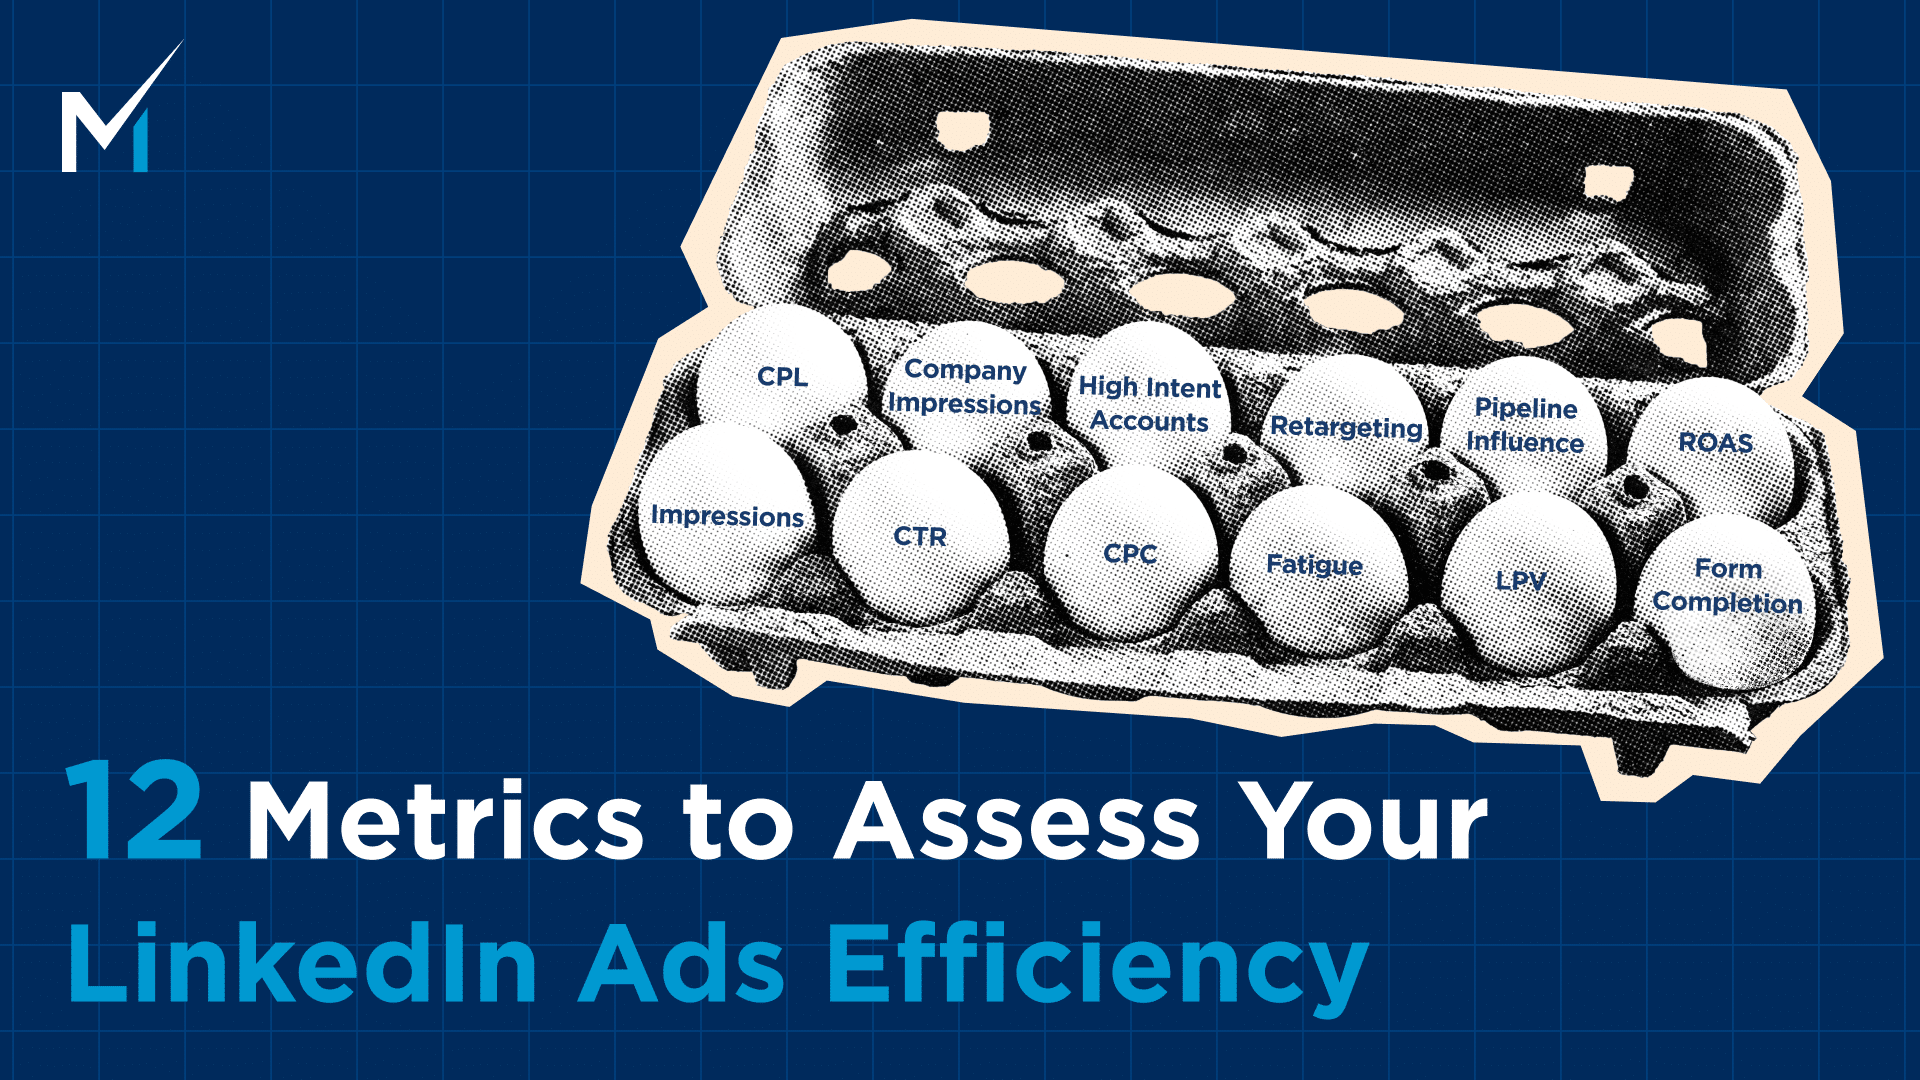
Here are the twelve metrics that actually tell you if your LinkedIn ads are working.
1. Impression Quality and Qualified Reach
Before you worry about clicks or costs, you need to confirm your ads are landing in front of the right people. Not random traffic. Not people outside your ICP. Actual buyers.
LinkedIn is one of the few platforms where you can see exactly who is engaging with you. Use it.
Because reach only matters if it’s hitting the people who can turn into pipeline.
Look at impression share inside your ICP first. You want the bulk of impressions going to the seniorities and functions that can buy.
If the campaign is heavy on interns, students, or entry level roles, your creative isn’t the problem. Your targeting is.
Then check frequency by seniority. A frequency of 3 to 5 across decision makers is usually healthy.
If senior leaders only see you once while coordinators see you eight times, the campaign has drift. That gap kills efficiency later because the people with budget never see the message enough to remember it.
Finally, validate your job title and company size breakdown. You should see your target company size, industry, and title clusters at the top.
If they’re not, the campaign is wasting money.
Who sees your ads matters more than how many. You can fix CTR and CPL later. You can’t fix an audience filled with the wrong people.
2. CTR vs Benchmark (Top of Funnel Efficiency)
CTR is the first real signal that your creative is doing its job. If people don’t stop the scroll, nothing under that metric matters.
Not your offer, not your retargeting, not your funnel logic.
You’ve got three useful benchmarks to anchor against. SERP competitor data puts the median CTR around 0.52 percent. DemandSense benchmark sits higher at 0.875 percent, roughly 35 percent above the platform average.
Impactable’s TOFU benchmark range runs 0.45 to 0.9 percent.
If your campaigns live inside that Impactable range, you’re in a healthy spot. Above it, even better. Below it, you don’t have a targeting problem. You have a relevance problem.
CTR tells you two things. Your hook and visual stopped the scroll, and your message actually meant something to the person seeing it.
If CTR is soft, the creative isn’t landing. If CTR drops week over week, the creative is fatiguing.
LinkedIn ad fatigue is predictable and punishes you fast when you ignore it.
Refresh creative before performance collapses, not after.
3. CPC and Cost Efficiency Signals
CPC gets thrown around like it’s a universal truth, but it’s only useful when you compare it to the right benchmarks and the right funnel stage.
A high CPC in BOFU can still be efficient. A low CPC in TOFU can still be useless. Context matters.
Platform median CPC sits around $3.94. Software and SaaS routinely pay more, closer to $8.04. DemandSense’s blended benchmark averages $5.59.
If you’re running SaaS campaigns and seeing four-dollar clicks, that’s not “expensive,” that’s actually cheap. If you’re in TOFU and paying nine, something’s off.
Always factor in industry and intent level before making a call.
The other thing to remember: compare CPC by funnel stage, not globally. TOFU will almost always be cheaper. BOFU will almost always cost more. That’s how intent works.
Higher intent audiences shrink, competition tightens, CPC rises.
What matters is whether those BOFU clicks turn into SQLs and revenue, not whether they beat your TOFU CPC.
Use CPC to diagnose, not to brag or panic.
4. Creative Fatigue Indicators
Creative eventually dies on LinkedIn. Not because the ads are bad, but because the same audience sees them too many times.
The key is catching the slide early instead of letting the campaign bleed for another week.
Here’s how long each format usually holds before performance drops.
- Single image runs 4 to 5 weeks.
- Carousel hits 7 weeks.
- Video lasts 9 weeks.
- Document ad holds 11 weeks.
- Thought Leader Ads stretch to 12 weeks.
Once you pass those ranges, expect the numbers to shift fast.
CTR declines, CPC rises, engagement falls, and frequency spikes because you’ve saturated your audience. When two or more hit at the same time, the creative is done.
Swap it before it drags the rest of your funnel down.
Creative rotation isn’t an optimization trick on LinkedIn. It’s required maintenance.
5. Landing Page Views and Form Open Rate
LinkedIn loves to show you clicks. What it doesn’t show you is what actually happens after the click, which is where most of the waste hides.
Landing page views and form opens are the real middle-funnel metrics. They tell you if people cared enough to stick around once they hit your site.
And this is where the drop-off gets ugly.
DemandSense benchmark data shows that only 2.99 percent of clickers even bother opening the form. Not completing it. Just opening it.
That gap explains why CPL can look “fine” in Campaign Manager while the funnel underneath is falling apart.
LPVs tell you if your landing page loaded fast enough and matched the promise of the ad. Form opens tell you if the offer made sense.
If LPVs are strong and form opens tank, the issue is the value exchange. If LPVs are weak, you have a page mismatch or a technical slowdown.
You can’t improve CPL if you don’t know where the leak starts.
6. Form Completion Rate (Lead Gen Efficiency)
Once someone opens your form, the hard part is over. They’ve already decided the offer is worth a look.
Now you’re testing friction. The fewer fields, the cleaner the copy, the higher the completion rate.
DemandSense data shows that once a user opens the form, 23.1 percent complete it. That’s the healthy range. If you’re way below that, the form is the problem, not your audience or your creative.
This is why form opens matter more than CTR when you’re trying to diagnose CPL.
CTR only tells you the ad was interesting enough to get a click. Form opens and completions tell you if the offer was delivered once the user got there.
Get these two in line, and CPL stabilizes fast.
7. CPL by Funnel Stage (Warm vs Cold Efficiency)
CPL only makes sense when you compare it to the audience type. A “high” CPL in a warm retargeting pool is bad. A “high” CPL in cold native prospecting is normal.
The mistake is judging everything against one global number.
Here’s how the ranges break out. Warm 1P BOFU runs 75 to 150. Warm 1P MOFU sits 120 to 250. ABM intent audiences land 250 to 400. Cold native climbs 300 to 600 plus.
This is why looking at a single CPL number is useless. You need to know the intent level behind it.
Warm first-party audiences should always be your cheapest and highest converting. ABM sits in the middle because you’re paying for precision. Cold native is where CPL climbs fast because the audience has zero context for who you are.
A “good” CPL is the one that matches the intent of the audience, not the one that beats an industry average.
8. Company Level Impressions and Engagement
Here’s the thing a lot of teams miss when they look at their dashboards. LinkedIn behaves more like a billboard than a search engine.
People rarely click, but they absolutely see your ads.
And if you only measure the people who click, you’re losing the bigger half of the story.
So the real question is simple. Which accounts actually saw you? And how often?
This is where account-level metrics start to matter. Number of target accounts that saw the ads. Impressions per account. Engagement actions by account. How often senior roles show up in the data.
Click data will never show you this. You need impression-level signals to understand who is warming up behind the scenes.
This ties directly into what DemandSense does. It pulls impression and engagement activity at the account level so you can see which companies are heating up, even if nobody clicked anything yet.
9. High Intent Account Count
If you want a better read on who is warming up, stop staring at single metrics. One click means nothing on its own. Same for one impression.
The real signal shows up when multiple actions stack together.
High intent account count blends signals like recency, frequency, clicks, views, and reactions. When these line up, you get a clearer picture of which accounts are heating up, even if nobody has filled out a form yet.
10. Retargeting Efficiency and Multi-Touch Lift
Retargeting isn’t just “cheaper clicks.” It’s the proof that your earlier spend is doing its job.
When someone comes back after seeing your ads for a few weeks, the intent gap is obvious.
Impactable’s benchmark shows it clearly. A 30 to 90-day demo page retargeting window drives a 2.5x higher demo-to-close rate.
That’s not a small bump. That’s the difference between a funnel that compounds and a funnel that leaks.
One thing to keep in mind: retargeting CTR should never be compared to TOFU CTR. These people already know you. They’ve hit your site. Maybe they watched your videos.
Comparing the two is like comparing a warm intro to a cold email.
11. Pipeline Influence
Once you zoom out past clicks and leads, this is the metric that usually changes how teams see LinkedIn.
Accounts that moved while they were being hit with your ads.
This isn’t attribution. This is velocity.
Here’s what actually matters:
- How many target accounts progressed in your CRM during the same window they were exposed to ads?
- Opportunities created or advanced during paid exposure.
- The weighted pipeline value that touched your ads somewhere in the journey.
When you look at it this way, you stop arguing about whether a click “counts” and start seeing how paid social keeps deals warm, accelerates cycles, and shows up in the moments that matter.
This is also where tools like DemandSense basically do the heavy lifting. You get the stage movements tied directly to impression windows, which gives you a clean read on influence without spreadsheets or guesswork.
12. Revenue Influence Per Dollar Spent
This is the one everyone wants to skip to, but it only makes sense once you’ve looked at all the signals before it.
When you’re running LinkedIn the right way, revenue influence per dollar spent gives you the real ROI picture.
Here’s what you’re actually checking:
- Which campaigns showed up in the journey of deals that closed?
- How many touches did each campaign contribute across the account?
- How much attributed revenue you generated for every dollar pushed into the platform?
This is also where last click attribution completely collapses.
LinkedIn almost never wins the last click. Your buyers usually see you in-feed, think about it, then Google you later or hit the site directly. If you only credit the final interaction, LinkedIn will look useless no matter how much it helped shape demand.
You need multi-touch influence to see the truth.
That’s where tools built for account-level tracking shine. They pull impression-level data, match it to revenue, and show you exactly which campaigns quietly moved the deal forward while Google gets all the credit.
Final Thoughts
Use the metrics in this guide, and you can make real improvements fast.
Tighten your pre-click performance, fix the middle funnel drop-offs LinkedIn never shows you, and watch which accounts actually warm up while your campaigns run. Those three layers alone will clean up a lot of wasted spend.
But here’s the part most teams underestimate.
Your LinkedIn plateau never comes from one metric. It’s the mix of audience quality, offer strength, creative fatigue, funnel friction, and how often people see your ads.
Two accounts can have the same CTR and same CPL and still be struggling for completely different reasons.
You can’t see that in the native dashboard. You only see it when you compare your full funnel against real performance bands and understand which levers move your specific situation.
If your LinkedIn performance feels stuck and you want to know where the real bottlenecks are, our team can help you map your account against benchmarks from hundreds of B2B advertisers.
We’ll show you exactly where your efficiency breaks, what’s causing it, and what to fix first.
If you want a clear plan instead of more guesswork, schedule a call with our team and we’ll walk you through it.