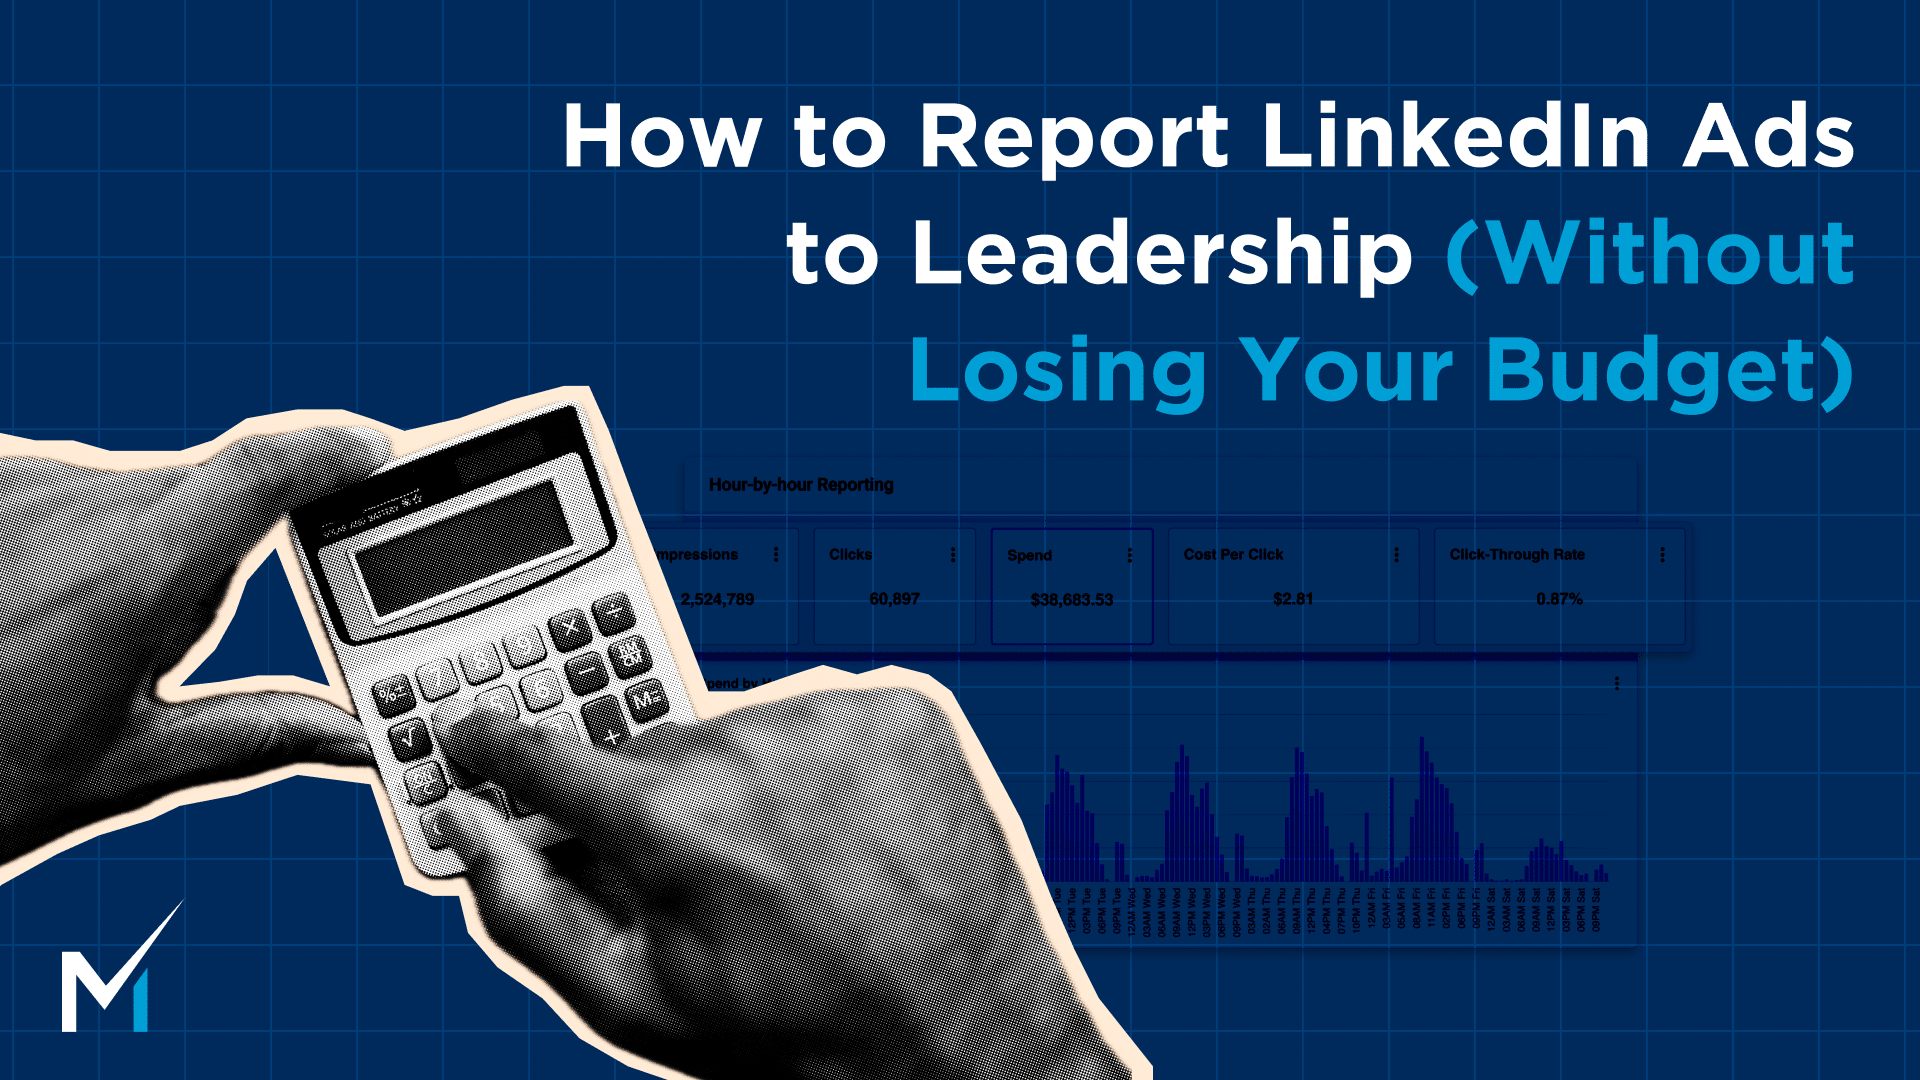
We’ve watched marketers walk into budget reviews with good LinkedIn programs — programs that were working — and walk out with their spend cut in half.
The ads weren’t the problem. The report was.
They presented CTR, CPC, impressions, engagement rate — a dashboard of platform metrics that mean something to the person running campaigns and nothing to the person approving budgets. The CFO sat through eight slides of ad vocabulary, then asked the only question they came to ask: “What did we get for the money?” And the room went quiet.
Here’s the uncomfortable truth about reporting: your LinkedIn program is evaluated on the quality of its translation, not the quality of its execution. A mediocre program reported in revenue language will outlive a great program reported in marketing language. That’s unfair. It’s also completely fixable.
The Two-Language Problem
Marketing and finance are measuring the same program with different vocabularies, and most reports never convert between them.
| What Marketing Reports | What Finance Hears | What Finance Actually Wants |
|---|---|---|
| CTR is up 40% | Nothing | — |
| CPL dropped to $310 | A cost with no context | Cost per pipeline dollar |
| 26 MQLs this month | Leads that may be worthless | Opportunities created |
| Engagement rate 4.2% | Nothing | — |
| 1.2M impressions | Nothing | Are we reaching accounts that can buy? |
The left column isn’t useless — it’s how you diagnose the program. CPL trend, frequency, and engaged accounts are the operating metrics we’ve covered in our 12 metrics to measure LinkedIn ads efficiency and performance. But operating metrics belong in your dashboard, not your board deck. The report going upward should be written entirely in the right-hand column.
The Three Numbers That Decide Your Budget
Strip everything else away, and leadership evaluates paid spend on three questions. Answer them every month and most other questions never come up.
1. Pipeline Created per Dollar Spent
Not leads. Pipeline. If you spent $9K and created $100K in qualified pipeline, that’s an 11:1 pipeline-to-spend ratio — a number a CFO can immediately weigh against every other use of the same dollars. This is the heart of measuring LinkedIn ads performance beyond conversions: it’s the single best monthly indicator of whether the program is building toward revenue.
2. CAC Payback Against the Company Benchmark
Finance already has a CAC payback number they consider healthy — for most B2B SaaS, somewhere between 12 and 18 months. Report LinkedIn-sourced CAC against that internal benchmark, not against an industry average from a blog post. “LinkedIn CAC pays back in 14 months, inside our 18-month threshold” is a sentence that ends budget conversations.
3. Influenced Pipeline, with the Methodology Stated
This is where B2B reporting gets hard, because last-click attribution doesn’t define B2B marketing results — influenced pipeline typically runs 3–5x higher than click-attributed numbers. Report both. Show the click-attributed floor and the influenced ceiling, and say plainly how each is measured. The moment you get caught presenting only the flattering number without methodology, you lose credibility on every number after it.
The Monthly Report Structure
One page. Five sections. In this order.
1. The headline sentence. One line, revenue language: “LinkedIn generated $118K in new pipeline this month at a 12:1 pipeline-to-spend ratio, tracking 8% ahead of forecast.” Whoever reads nothing else reads this.
2. Actuals vs. forecast. A four-row table: spend, leads, pipeline created, revenue closed — forecast next to actual. This assumes you built a forecast before launching — starting with how much you should spend on LinkedIn ads and what that spend should produce. The forecast converts every monthly report from “here’s what happened” into “here’s how we’re tracking against what we said would happen.” Those are two entirely different credibility positions.
3. Pipeline detail. Named accounts that entered pipeline this month with LinkedIn touchpoints. Five logos your sales team recognizes beat any aggregate statistic. If you’re using intent or signal data — we use DemandSense for this — show which target accounts are actively engaging even before they’ve converted. Watching a named target account heat up over three consecutive reports is the most persuasive slide in B2B marketing.
4. What we’re changing. Two or three bullets on optimizations in flight. This signals the program is managed, not just running.
5. What happens next month. Expected pipeline, deals likely to close from earlier cohorts, and anything leadership should expect to look weird before it looks good.
Reporting Through the Dead Zone
The hardest reports to write are months one through four, when spend is real and closed revenue is zero. This is where most budgets die — not because results are bad, but because nobody set the timeline expectation upfront.
The fix is structural: your very first report, before launch, is the forecast itself — including the month-by-month table showing exactly when revenue can physically appear given your sales cycle. Then every early report measures against the leading indicators that should be moving: audience build, engaged target accounts, CPL trend versus cold benchmarks, pipeline created. We’ve broken down the signs your LinkedIn ad strategy actually needs fixing versus normal early-stage noise — the reporting version of that advice is simple: never let a stakeholder discover the revenue lag in month three. Make them sign off on it in month zero.
Match the Cadence to the Audience
One report doesn’t serve everyone, and trying to make it do so is how you end up with a CFO reading about frequency caps. Three cadences, three depths:
Weekly — yours. The operating dashboard: CPL trend, frequency, pool growth, spend pacing. This never goes upward. It’s how you catch problems while they’re still cheap.
Monthly — your VP or CMO. The one-page structure above. Pipeline created, forecast tracking, named accounts, changes in flight. Fifteen minutes to read, zero platform vocabulary.
Quarterly — finance and the exec team. Zoom out: pipeline-to-spend trend across the quarter, CAC payback versus threshold, closed revenue from earlier cohorts finally landing, and the scale question — what the model says happens at higher spend. Quarterly is also the right altitude for the sales-cycle math, because a quarter is long enough for cause and effect to actually connect.
The discipline here is resisting the urge to over-report early. Sending leadership a weekly LinkedIn update during the dead-zone months invites weekly judgment of a program that moves monthly. Report at the speed the channel produces meaning, not at the speed the dashboard refreshes.
The Meeting Where Everything Goes Wrong
At some point you’ll get the meeting invite titled “Paid Channel Review” that actually means “we’re deciding whether to cut LinkedIn.” Three rules for that room:
Bring the CRM data, not the Campaign Manager data. Screenshots of platform dashboards read as marketing defending marketing. Pipeline reports pulled from the CRM read as evidence.
Concede the weak number first. If click-attributed ROAS is ugly, open with it — then walk through why the measurement window can’t capture a 6-month sales cycle, and show the influenced number with methodology. Preempting the objection is 10x more credible than being confronted with it.
Anchor on the cost of stopping. Retargeting pools, audience learnings, and account engagement decay when spend stops. Restarting later means paying cold-audience prices all over again. “Pausing saves $9K a month and forfeits $340K in engaged pipeline” is a real trade-off framing, and it’s usually accurate.
Your Report Is the Product
Here’s the mindset shift that separates marketers who keep budgets from marketers who fight for them annually: the campaigns are what you run, but the report is what leadership buys. It deserves the same craft.
Written in revenue language, anchored to a pre-launch forecast, honest about attribution, delivered on the same one-page structure every month — that report doesn’t just defend a budget. It’s how LinkedIn goes from “the channel we’re testing” to a line item nobody questions.
If you want a second set of eyes on how your program’s story reads before your next budget review, book a strategy call. We’ve sat on both sides of that meeting more times than we can count.